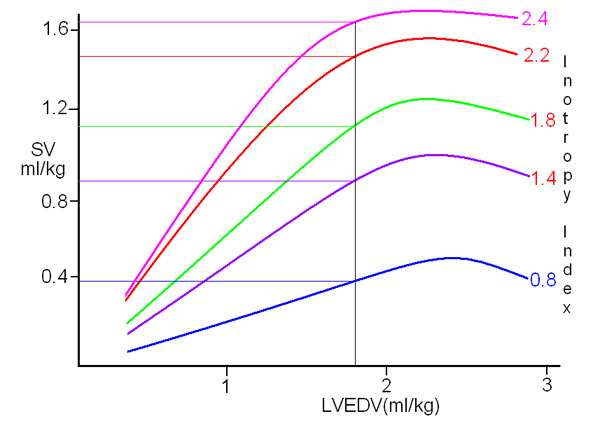
SMII and LVEDV.
Let’s go back to the Frank-Starling curve below and think backwards.

This figure shows five different Frank-Starling curves for five different levels of inotropy. For a given LVEDV of 1.8ml/kg, there are five possible stroke volume figures depending on the inotropy status. The gradient of the Starling curve is, in effect, the ejection fraction, being the stroke volume divided by the LVEDV. Indeed this is where the concept that ejection fraction equates to inotropy comes from. Therefore, if we know the gradient from the SMII, and we know the stroke volume, then the LVEDV can be calculated fairly simply.
For a 70kg patient with a stroke volume of 85ml and an SMII of 1.6W/m2 (green line) the LVEDV would be 126ml. His ejection fraction would be 85/126 or 67.5%. For the same SMII and a stroke volume of 56ml his LVEDV would be 91ml.
In the same way as we use cardiac index to compare cardiac output in individuals of varying size, so we can use left ventricular end diastolic volume index, LVEDVI, to “standardize” the normal LVEDV. In practice this turns out to be around 65 - 85ml/m2. A figure below 65ml/m2 indicates inadequate preload, while values above 85ml/m2 are seen in fluid overload and LVF. In clinical practice, SMII-derived LVEDVI correlates very well with echocardiographic measurements of LVEDV. One big difference however is that echocardiography takes 20 - 30 minutes to do properly, even in the hands of an expert echocardiographer; the SMII-derived LVEDVI takes about 2 minutes, and you can do it!
Limitations of this method.
The above makes the very important assumption that the heart is structurally normal. If there is significant valvular disease such as aortic stenosis or regurgitation then the true LVEDV will be higher than predicted. Similar problems relate to mitral valve regurgitation, VSD with left to right shunt and ventricular aneurysm or large akinetic segments of the ventricular wall. These should be excluded, or at least allowed for when estimating LVEDVI.
The calculation of LVEDV from SMII is still undergoing evaluation and validation and certainly appears to be valid in most cases, but results should be treated with some caution until validation has been completed and limitations of the method identified. Any feedback on this would be gratefully received! The calculation of LVEDV from SMII is included in the “Inotropy 2009” software.
Stroke Volume and Preload.
Perhaps the most obvious fact about preload however is the simplest. If SMII is anything like normal, and afterload is even in the right ballpark, then stroke volume is a direct function of preload. If SV is low (see normal values) then preload is low, and SV will rise and fall almost linearly with preload.
Similarly, if preload remains fairly stable then any increase in SV must be due to either an increase in inotropy, or a fall in afterload. The clinical situation should make it obvious which one has occurred in most cases.
|

